


 Release time:2023-05-17
 Viewed:117775 times


In 2022, the new installed capacity of global energy storage is about 40.2GW, of which: the new installed capacity of energy storage is about 21.8GW, accounting for 54.3%; The newly installed capacity of pumped storage energy is about 17.9GW, accounting for 44.5%; The new installed capacity of thermal and cold storage is about 0.5GW, accounting for 1.2%.

Figure 1: New installed power of global energy storage in 2022
Global new energy storage cumulative installed lithium-ion batteries dominate in 2022
In the global cumulative installation of new energy storage in 2022, the proportion of each technology path is as follows: lithium-ion batteries account for 86.8%, compressed air accounts for 5.4%, flywheel energy storage accounts for 2.8%, sodium ion batteries account for 1.3%, lead batteries account for 1.1%, and flow batteries account for 0.9%.
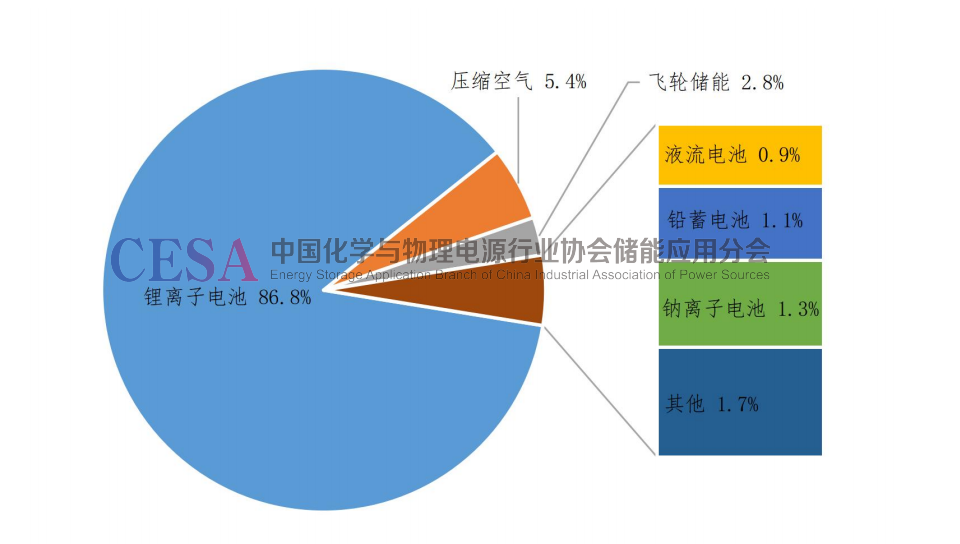
Figure 2: Global Distribution of Accumulated Installed Technologies for New Energy Storage in 2022
In the global new energy storage installation in 2022, the proportion of various technological paths is as follows: lithium-ion batteries account for 92.6%, compressed air accounts for 3.3%, flywheel energy storage accounts for 1.4%, flow batteries account for 0.8%, sodium ion batteries account for 0.5%, and lead batteries account for 0.2%.

Figure 3: Global Distribution of New Energy Storage Newly Installed Technologies in 2022
The United States, East Asia, Europe, and Australia collectively account for approximately 90% of the global market
Currently, the United States, East Asia, Europe, and Australia have led the development of new energy storage markets worldwide, accounting for approximately 90% of the global market.
In 2022, the cumulative installed power of new energy storage in the United States was 11.4GW, with an additional installed power of 4.8GW. The cumulative installed power in Germany is 5.8GW, and the newly added installed power is 2.9GW. The cumulative installed power in Australia is 5.6GW, and the newly added installed power is 2.8GW. The cumulative installed power in Japan is 2.1GW, and the newly added installed power is 1.0GW.
The cumulative installed power of energy storage in China in 2022 is 56.9GW, and the cumulative installed power of new energy storage is about 11.2GW
The cumulative installed power of energy storage in China in 2022 is 56.9GW, of which the cumulative installed power of new energy storage is about 11.2GW, accounting for 19.8% of the total installed energy storage capacity; The cumulative installed power of pumped storage is about 45.1GW, accounting for 79.3% of the total installed energy storage capacity; The cumulative installed power of cold and heat storage is about 0.5GW, accounting for 0.9% of the total installed energy storage capacity.
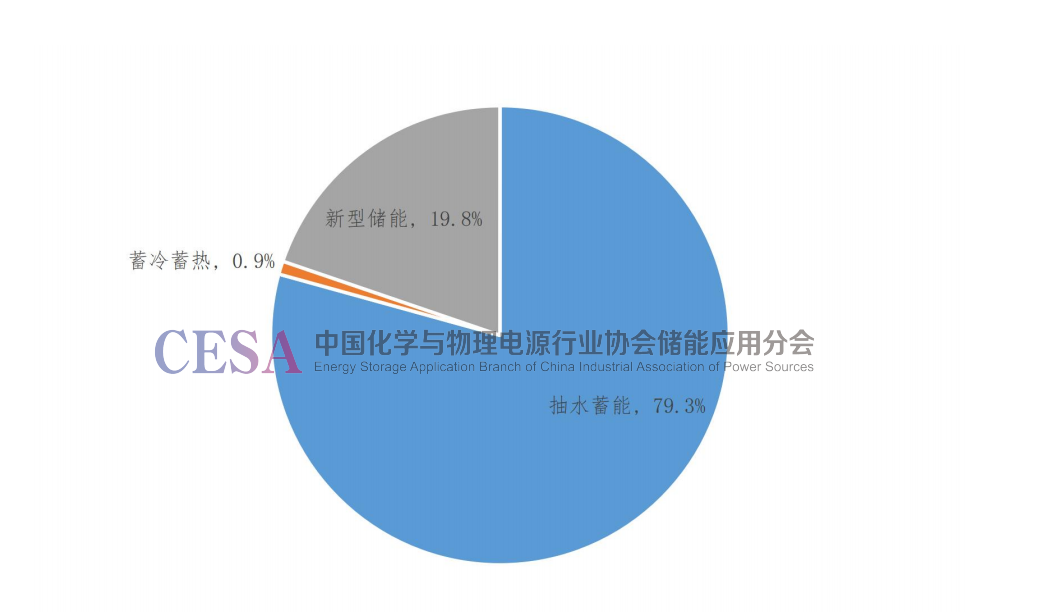
Figure 4 Accumulated installed power of energy storage in China in 2022
In 2022, China's new installed capacity for energy storage will be approximately 14.7GW, of which: the new installed capacity for energy storage will be approximately 5.9GW, accounting for 40.1%; The newly installed capacity of pumped storage energy is about 8.8GW, accounting for 59.8%; The newly installed capacity of thermal and cold storage is approximately 69.5MW.
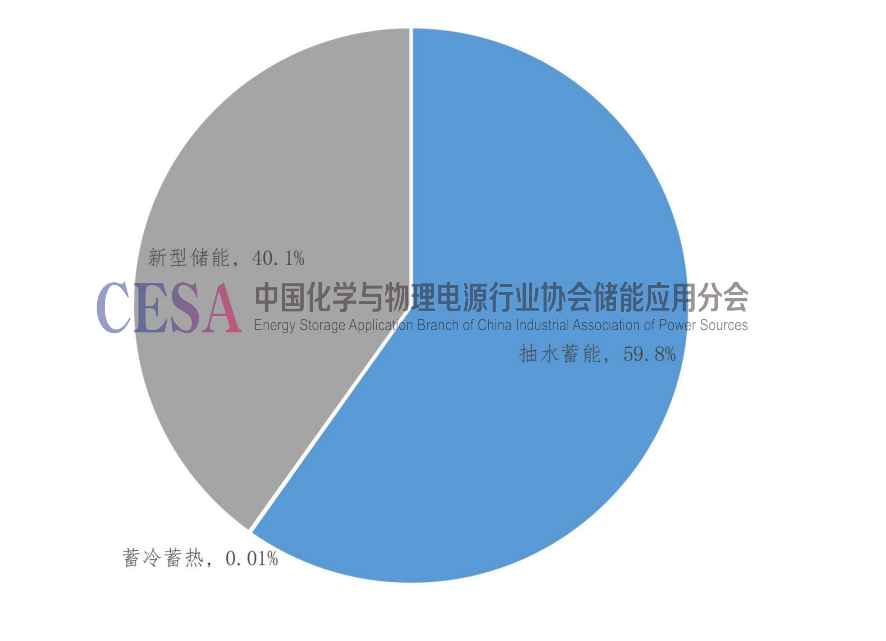
Figure 5: New installed power of energy storage in China in 2022
In 2022, the proportion of lithium-ion batteries in China's newly installed new energy storage capacity is 90.7%
In the cumulative installation of new energy storage in China in 2022, the proportion of each technology path is as follows: lithium-ion batteries account for 89.6%, compressed air accounts for 1.6%, flywheel energy storage accounts for 0.2%, lead batteries account for 2.6%, and flow batteries account for 2.5%.
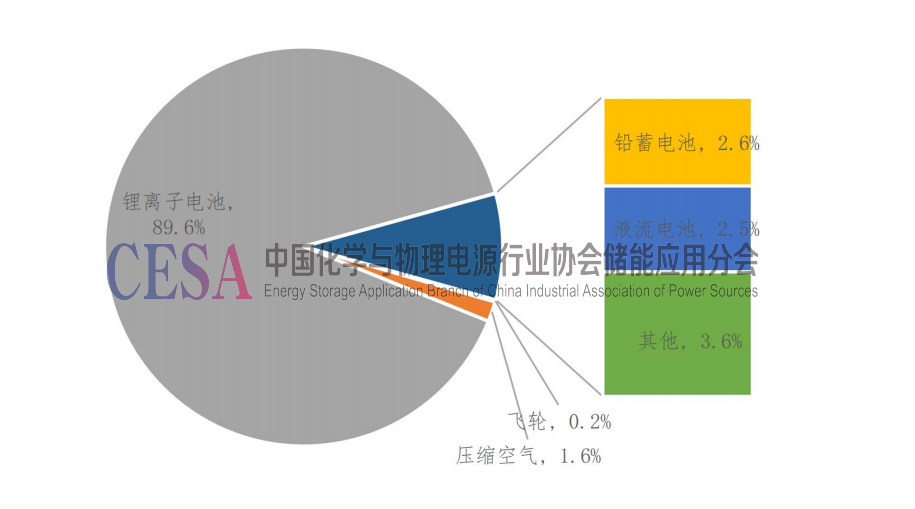
Figure 6 Distribution of cumulative installed technologies for new energy storage in China in 2022
In the new energy storage installations in China in 2022, the proportion of various technological paths is as follows: lithium-ion batteries account for 90.7%, compressed air accounts for 1.9%, flywheel energy storage accounts for 0.3%, lead batteries account for 0.8%, and flow batteries account for 3.5%.
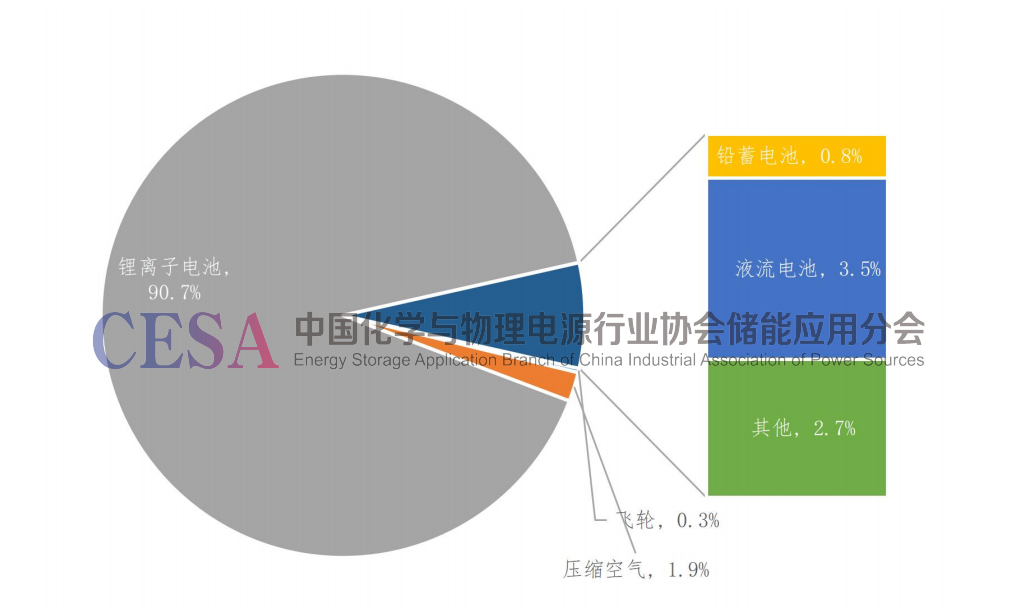
Figure 7 Distribution of New Energy Storage and Installation Technologies in China in 2022
In 2022, China's centralized new energy distribution and storage account for 37.9% of the newly installed capacity of new energy storage
From the perspective of application scenarios, centralized new energy distribution and storage still account for the highest proportion of new energy storage installations in China in 2022, followed by grid side energy storage and power side auxiliary services (peak shaving/frequency regulation). The use of user side energy storage also determines its characteristics of multiple projects and small scale. In addition, a new application scenario of shared energy storage projects has been added according to the type of projects put into operation. Up to 93 centralized new energy distribution and storage projects have been put into operation, with an installed power of 2.2GW; 23 grid side energy storage projects have been put into operation, with a total installed power of 1.4GW; A total of 12 shared energy storage projects have been put into operation, with a scale of 1.1GMW; A total of 15 power side peak shaving/frequency modulation projects have been put into operation, with an installed power of 0.6GW; The user side energy storage project (excluding microgrids) and the distributed microgrid energy storage project (belonging to user side energy storage) have respectively put into operation 72 and 20 projects, but their operational scale is only 347MW. The distribution of new energy storage installations in 2022 according to application scenarios is as follows.

Figure 8 Distribution of New Energy Storage Installed Capacity Applications in China in 2022
In 2022, new energy storage will mainly be concentrated in the eastern and western regions of China
In 2022, new energy storage is mainly concentrated in East China and Northwest China (accounting for 55.5% of the total). More than 20 provinces such as Shandong, Jiangsu, Zhejiang, Fujian, Guangxi, Inner Mongolia, and Ningxia have issued new energy configuration and storage policies, significantly driving the demand for local new energy storage markets. Compared to this, the increment of new energy storage in the southwest and northeast regions is relatively small (the total proportion of the two is only 5.2%), which is also related to the fact that provinces and cities such as Heilongjiang, Jilin, Yunnan, Sichuan, and Chongqing have not yet released relevant energy storage configuration policies.
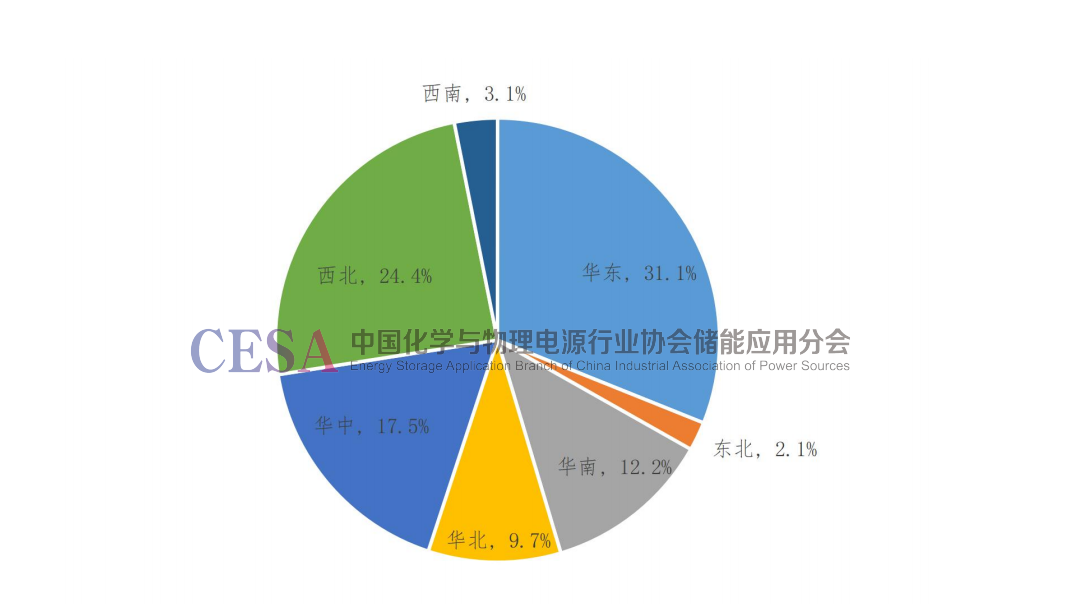
Figure 9 Distribution of New Energy Storage Regions in China in 2022
From the distribution of energy storage application scenarios in various regions, the North China and Northwest regions mainly focus on new energy distribution and storage, while the East China region has a relatively balanced distribution of new energy distribution and storage, grid side energy storage, and user side energy storage. The South region mainly focuses on thermal power plant energy distribution and storage. Relatively speaking, the equivalent utilization coefficient of new energy distribution and storage in North China and Northwest China is higher than that in other regions.
By the end of 2025, China's cumulative installed capacity of new energy storage will reach 70GW
The "Guiding Opinions on Accelerating the Development of New Energy Storage" issued by the National Development and Reform Commission and the Energy Administration in 2022 proposed that the installed capacity of new energy storage should reach over 30GW by 2025. If a cost mitigation mechanism is established and promoted, considering the completion of all existing planned, under construction, and bidding new energy storage projects by the end of the 14th Five Year Plan, the cumulative installed capacity of new energy storage projects in China by the end of 2025 may reach 70GW (excluding pumped storage). It is expected that the scale of China's new energy storage market is expected to reach 15GW-20GW by 2023. The total increment between 2023 and 2025 is close to 60GW (excluding pumped storage), and the cumulative scale is expected to reach around 70GW by 2025.
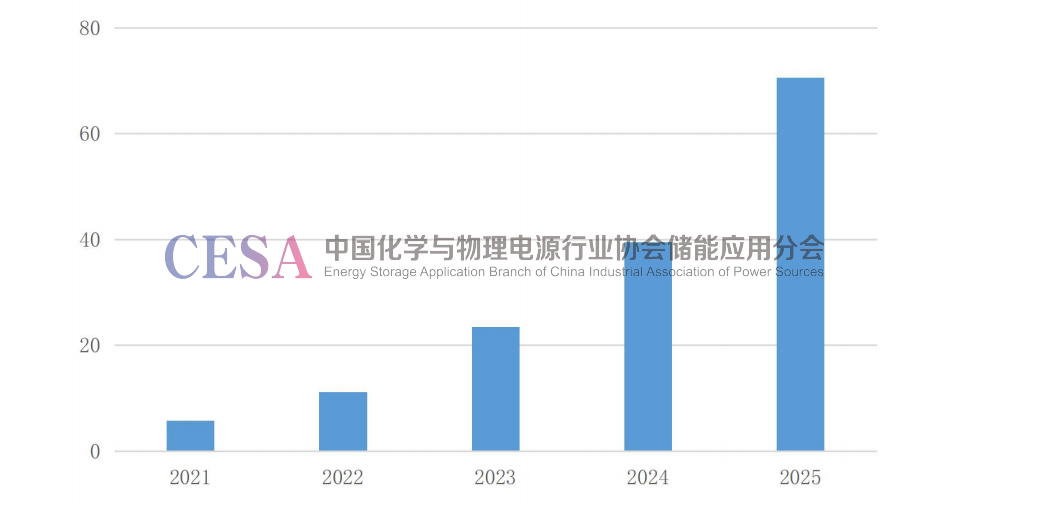
Figure 10 Prediction of Accumulated Installed Capacity of New Energy Storage during the 14th Five Year Plan (GW)
Note: The source and copyright of the article belong to China Energy Storage Network, and Jurmay Technology is only for reprinting and sharing.